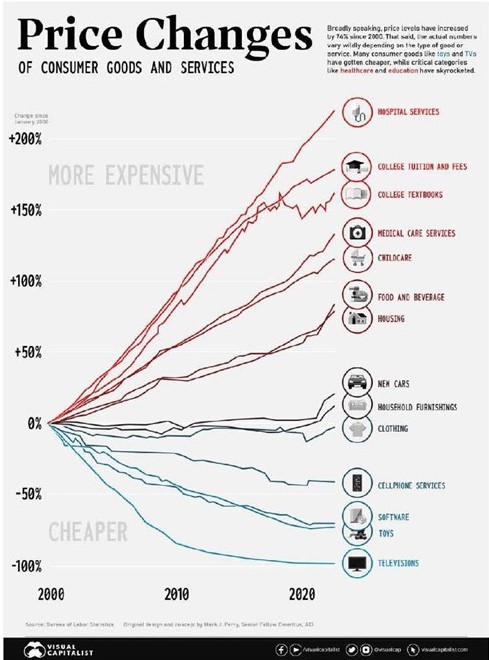
US Consumer Price Inflation, by type of Goods or Services (2000-2022)
Since the start of the 21st century, U.S. Consumers have seen a divergence of price movements across variation categories. Nowhere is this better illustrated than on this chart concept thought up by AE!’s Mark J. perry. Its sometimes referred to as the “chart of the century” because it provides such a clear and impactful jump-off point to discuss several economic forces. The punchline is that many consumer goods particularly those that were easily outsourced saw prices drops, while key “non-tradable” categories saw massive increases.