

The price-to-earnings (PE) ratio, sometimes known as the price multiple or the earnings multiple, is one of those terms that gets thrown everywhere. But how is it calculated and what does it mean?
Simply put, a P/E ratio of 15 would mean that the current market value of the company is equal to 15 times its annual earnings. Put literally, if you were to hypothetically buy 100% of the company’s shares, it would take 15 years for you to earn back your initial investment through the company’s ongoing profits assuming the company never grew in the future.
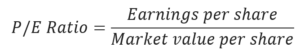
How it’s calculated: The PE ratio is calculated by dividing a company’s share price by its earnings per share.
The current stock price (P) can be found simply by plugging a stock’s ticker symbol into any finance website, and although this concrete value reflects what investors must currently pay for a stock, the EPS is a slightly more nebulous figure.
EPS comes in two main varieties. TTM is a Wall Street acronym for “trailing 12 months“. This number signals the company’s performance over the past 12 months. The second type of EPS is found in a company’s earnings release, which often provides EPS guidance. This is the company’s best-educated guess of what it expects to earn in the future. These different versions of EPS form the basis of trailing and forward P/E, respectively.
For example, Commonwealth Bank reported an FY23 earnings per share of 602 cents. By dividing its share price of $100.6 by 602 cents – You get a PE ratio of 16.7.
Companies that have no earnings or that are losing money do not have a P/E ratio because there is nothing to put in the denominator.
What does it mean: The number represents the amount of money you are paying for each dollar of earnings.
For example: Commbank’s PE ratio of 16.7 implies that you will pay roughly $16.7 for every dollar of earnings that the bank makes.
In general, a high P/E suggests that investors are expecting higher earnings growth in the future compared to companies with a lower P/E. A low P/E can indicate either that a company may currently be undervalued or that the company is doing exceptionally well relative to its past trends. When a company has no earnings or is posting losses, in both cases, the P/E will be expressed as N/A. Though it is possible to calculate a negative P/E, this is not the common convention.
Many investors will say that it is better to buy shares in companies with a lower P/E because this means you are paying less for every dollar of earnings that you receive. In that sense, a lower P/E is like a lower price tag, making it attractive to investors looking for a bargain. In practice, however, it is important to understand the reasons behind a company’s P/E. For instance, if a company has a low P/E because its business model is fundamentally in decline, then the apparent bargain might be an illusion.
Understanding high PEs: A stock with a PE ratio of more than 30 is often viewed as ‘expensive’. But here’s a different way to look at things:
- XYZ company is a fast-growing tech company with a PE ratio of 50
- XYZ company reports its FY23 results and net profits are up 100%
- If profits double, this implies the PE ratio is now only 25
High PE ratio companies are often fast growing ones, which acts as a double edge sword – It can only justify its expensive valuation if it continues to grow. If growth comes in below expectations, then its share price can de-rate rather quickly.
What about low PEs: A stock with a PE ratio of less than 10 is often viewed as ‘cheap’. But they’re generally cheap for a reason:
- Lots of resource companies trade at single-digit PEs but what happens in FY24 when most commodity prices are below FY23 levels
- Lots of retail stocks appear ‘cheap ‘but current consumer confidence and retail trade data says otherwise, again what happens when FY24 comes around
- XYZ company might downgrade its earnings outlook, it’s shares tumble but this has yet to be reflected in its valuation
How is it useful: Here are a few more examples of how the PE ratio can be used to analyse and compare different stocks.
P/E ratios are used by investors and analysts to determine the relative value of a company’s shares in an apples-to-apples comparison to others in the same sector. It can also be used to compare a company against its own historical record or to compare aggregate markets against one another or over time.
- As a comparison tool: CSL trades at a PE ratio of 58 while its peers like ProMedicus trades at 125 while Sonic Healthcare trades at just 15
- Market perception: Commbank trades at a much higher PE ratio than its Big 4 Bank peers because it is often perceived to have high earnings stability and a strong dividend plan. In some ways, there are two choices here: Pay the premium (for CBA’s perks) or pay for value (because the others are cheaper).
P/E ratios also come in two kinds: trailing and forward. And as you would expect, trailing P/Es are based on previously announced earnings while forward P/Es tend to centre around what analysts think earnings will be in the future.
One primary limitation of using P/E ratios emerges when comparing the P/E ratios of different companies. Valuations and growth rates of companies may often vary wildly between sectors due to both the different ways companies earn money and the differing timelines during which companies earn that money.
As such, one should only use P/E as a comparative tool when considering companies in the same sector because this kind of comparison is the only kind that will yield productive insight. Comparing the P/E ratios of a telecommunications company and the P/E of an oil and gas drilling company, for example, may lead one to believe that one is clearly the superior investment, but this is not a reliable assumption.
because a company’s debt can affect both the prices of shares and the company’s earnings, leverage can skew P/E ratios as well. For example, suppose there are two similar companies that differ primarily in the amount of debt they assume. The one with more debt will likely have a lower P/E value than the one with less debt. However, if the business is good, the one with more debt stands to see higher earnings because of the risks it has taken.
Because a company’s debt can affect both the prices of shares and the company’s earnings, leverage can skew P/E ratios as well. For example, suppose there are two similar companies that differ primarily in the amount of debt they assume. The one with more debt will likely have a lower P/E value than the one with less debt. However, if the business is good, the one with more debt stands to see higher earnings because of the risks it has taken.